Visualization View
An interactive visual representation of memory relationships:
Memory Statistics: Same statistics as table view:
- Total: Total number of memories in the system
- Filtered: Number of memories matching current filters
- Knowledge: Count of knowledge-based entries
- Conversation: Count of conversation-based entries
Visualization Settings:
Algorithm Selection: Choose the dimensionality reduction algorithm:
- t-SNE (t-Distributed Stochastic Neighbor Embedding):
- Best for: Revealing clusters and local structure
- Use when: You want to see how memories group together
- Characteristics: Preserves local relationships, good for pattern discovery
- UMAP (Uniform Manifold Approximation and Projection):
- Best for: Preserving global structure while showing local patterns
- Use when: You want to understand overall memory organization
- Characteristics: Faster than t-SNE, maintains both local and global structure
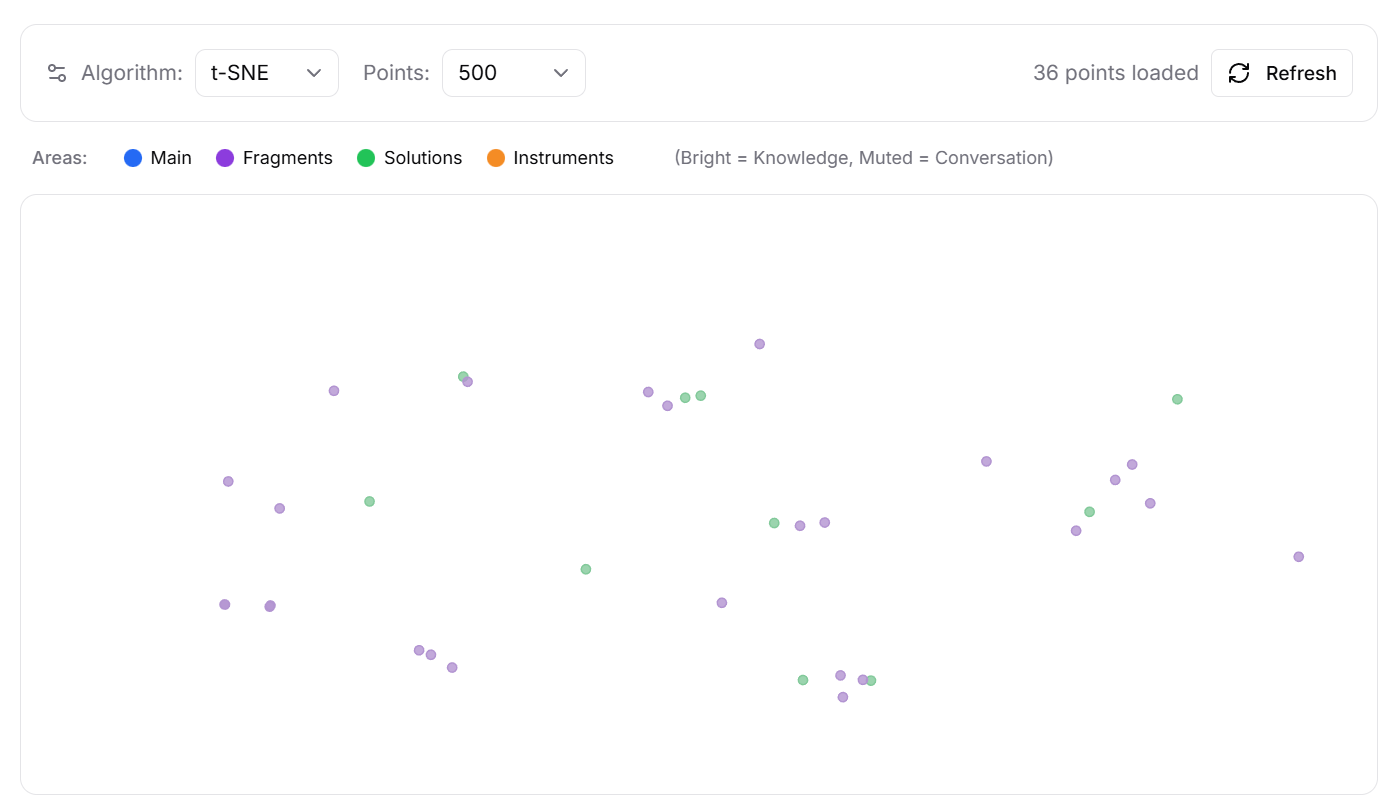
Fig 4.3
Points Setting: Control how many memory points to visualize:
- Range: Typically 100 to 2000 points
- Default: 500 points
- Purpose: Balance between detail and performance
Last updated on